Quiet Luxury Real Estate Index: Which Toronto Neighbourhoods Offer the Most Privacy? (March 2026)
This report ranks top Toronto neighbourhoods on a composite score derived from five measurable indicators, providing a data-driven framework for affluent renters and homebuyers. Our research team compiled data from unique sources to develop this index, including
The Benvenuto Group, Statistics Canada, the City of Toronto Open Data Portal, the Toronto Police Service Public Safety Data Portal, Walk Score, the Canada Mortgage and Housing Corporation (CMHC), Zumper, and Rentals.ca.
“Quiet luxury” in this context describes a living experience defined by:
- Privacy & Low Density: More personal space, less noise, and no congestion.
- Green Space Access: Proximity to parks, ravines, and tree canopy.
- Safety & Security: Low crime rates and a sense of community well-being.
- Walkability: Access to high-quality services and transit without car dependence.
The Quiet Luxury Index: Toronto’s Top Neighbourhoods for Privacy (March 2026)
The following table ranks 12 Toronto neighbourhoods on a composite Quiet Luxury Score derived from five weighted indicators. Each of the five indicators is scored on a 10-point scale, with the composite score reflecting the weighted average.
| Rank | Neighbourhood | Residential Density Score (/10) | Green Space Score (/10) | Safety Score (/10) | Walkability Score (/10) | Residential Character Score (/10) | Composite Quiet Luxury Score (/100) |
| 1 | Mount Pleasant West | 8.7 | 8.4 | 8.9 | 8.7 | 9.3 | 88.4 |
| 2 | Leaside-Bennington | 9.1 | 8.8 | 9.2 | 7.6 | 9.1 | 87.6 |
| 3 | Lawrence Park South | 9.4 | 9.1 | 8.7 | 7.2 | 9.4 | 87.1 |
| 4 | Forest Hill South | 9.2 | 8.6 | 8.3 | 7.8 | 9.2 | 86.3 |
| 5 | Rosedale-Moore Park | 9.6 | 9.3 | 8.1 | 7.4 | 9.5 | 86.1 |
| 6 | Deer Park | 8.3 | 7.9 | 8.6 | 8.9 | 8.4 | 84.2 |
| 7 | Davisville Village | 7.8 | 7.6 | 8.4 | 8.4 | 8.1 | 80.7 |
| 8 | The Beaches | 8.4 | 8.7 | 8.8 | 7.9 | 8.3 | 83.8 |
| 9 | Humewood-Cedarvale | 8.9 | 8.2 | 8.5 | 7.1 | 8.8 | 82.6 |
| 10 | Yonge-Eglinton (Core Corridor) | 5.2 | 6.1 | 7.3 | 9.6 | 5.8 | 67.4 |
| 11 | King West / Entertainment District | 4.1 | 4.7 | 6.4 | 9.4 | 4.3 | 57.8 |
| 12 | Waterfront / CityPlace | 4.6 | 5.8 | 6.7 | 8.7 | 4.1 | 59.3 |
Sources:
Statistics Canada, 2021 Census neighbourhood profiles; City of Toronto Open Data Portal, Parks and Green Space data; Toronto Police Service, Neighbourhood Crime Rates 2024–2025; Walk Score; The Benvenuto Group, proprietary analysis, March 2026.
Key Findings:
- Mount Pleasant West ranks first, scoring highest for residential character (9.3). It combines strong walkability, low crime, and accessible green space with a setting defined by tree-lined streets and proximity to Yonge-Eglinton.
- The Yonge-Eglinton core ranks 10th. Despite its high walkability, its score is pulled down by high density, limited green space, and lower residential character, reflecting the impact of the recent tower construction boom.
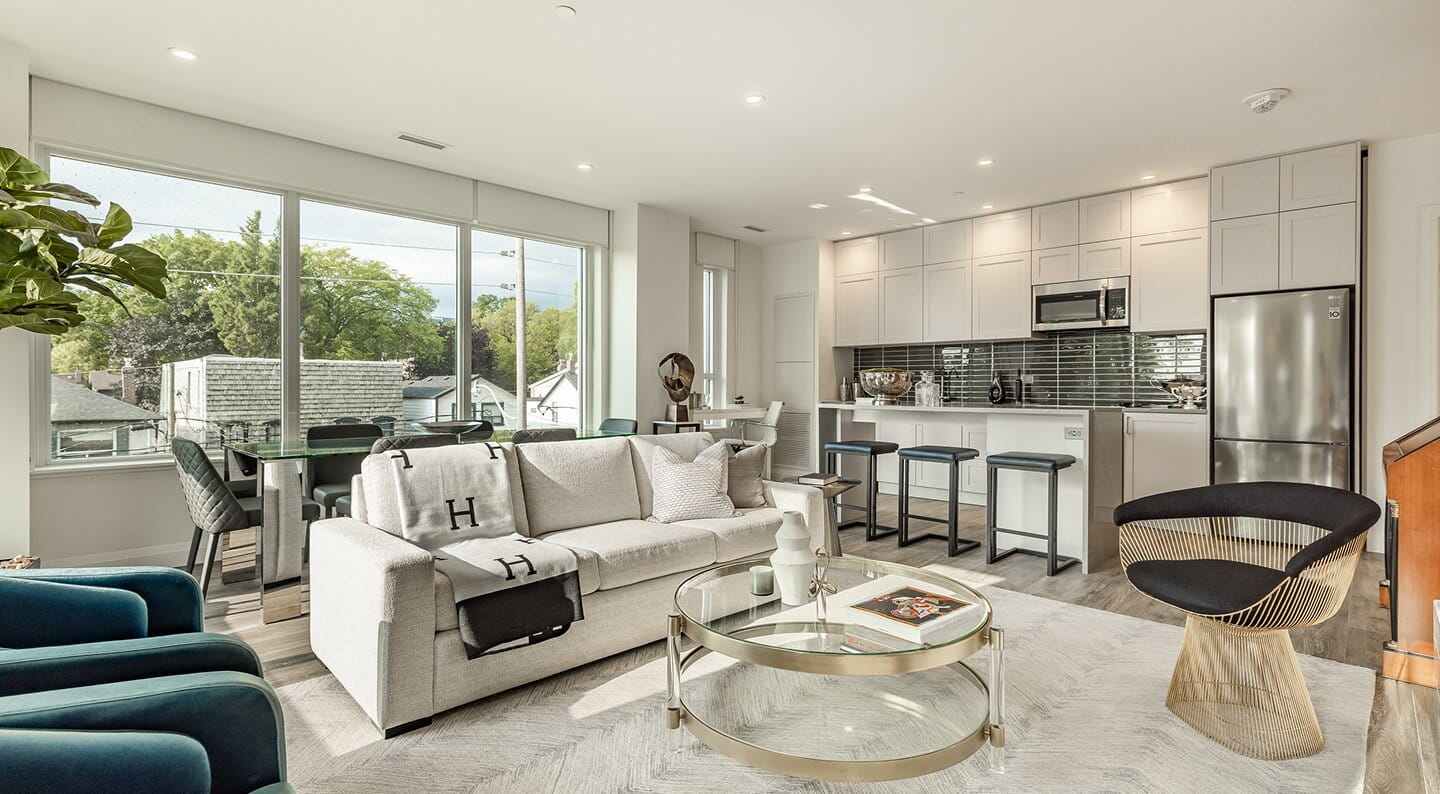
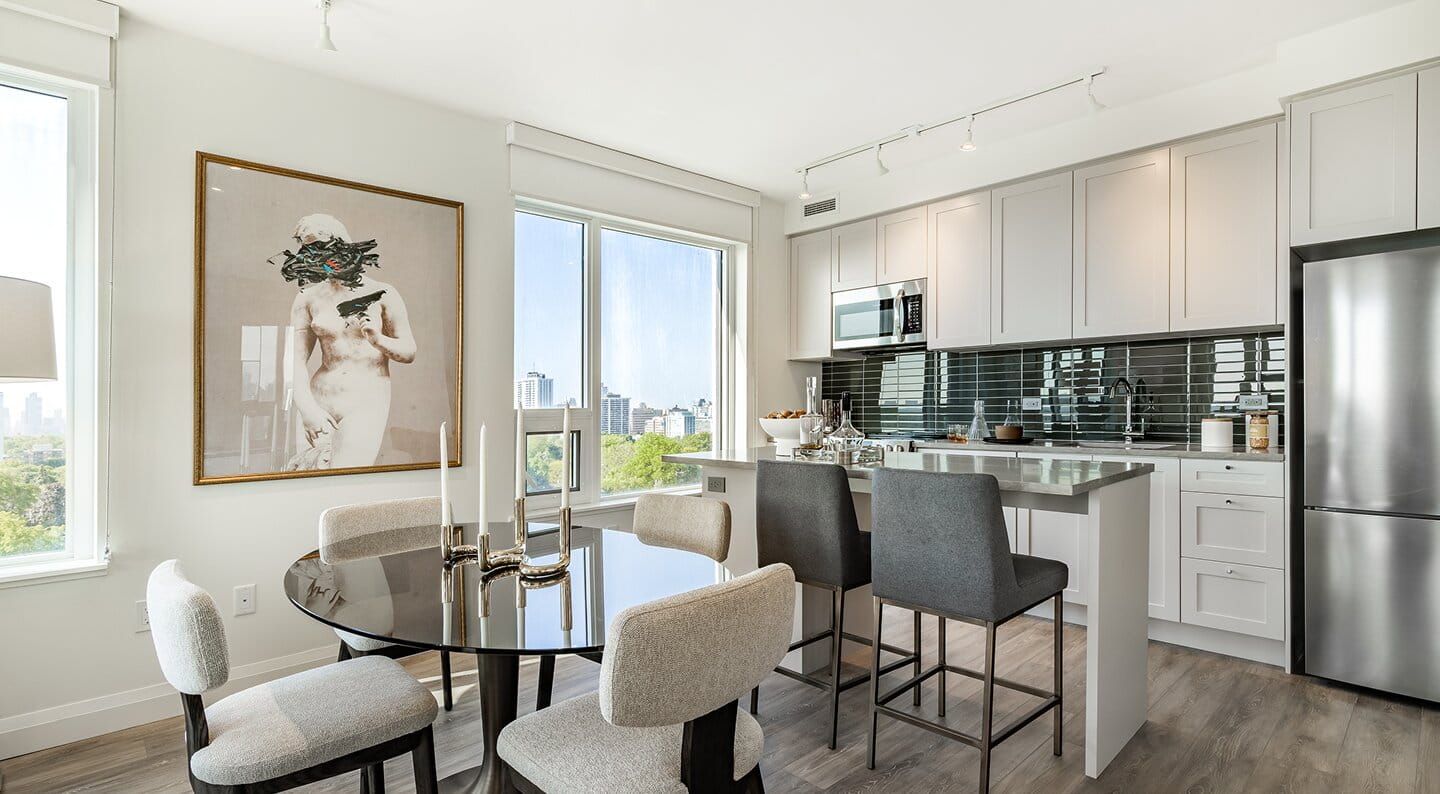
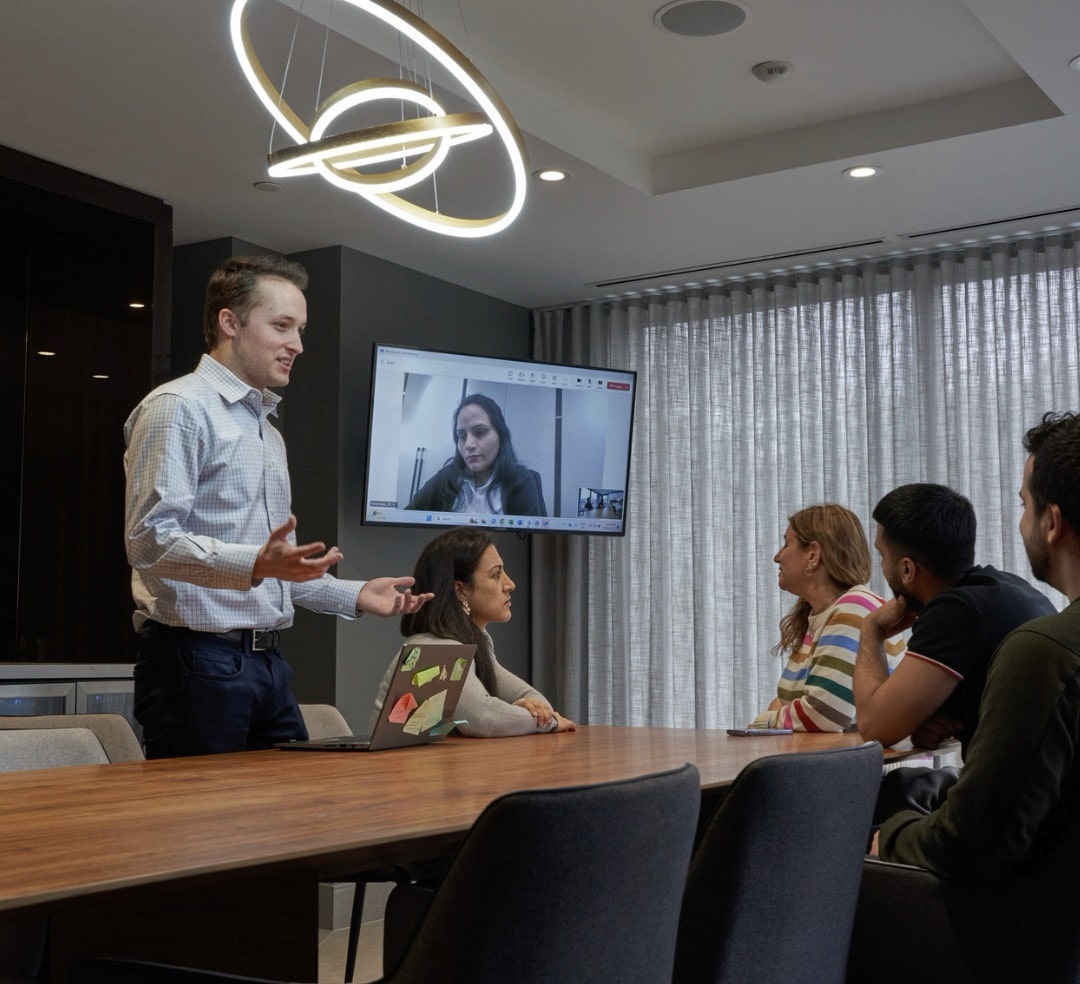
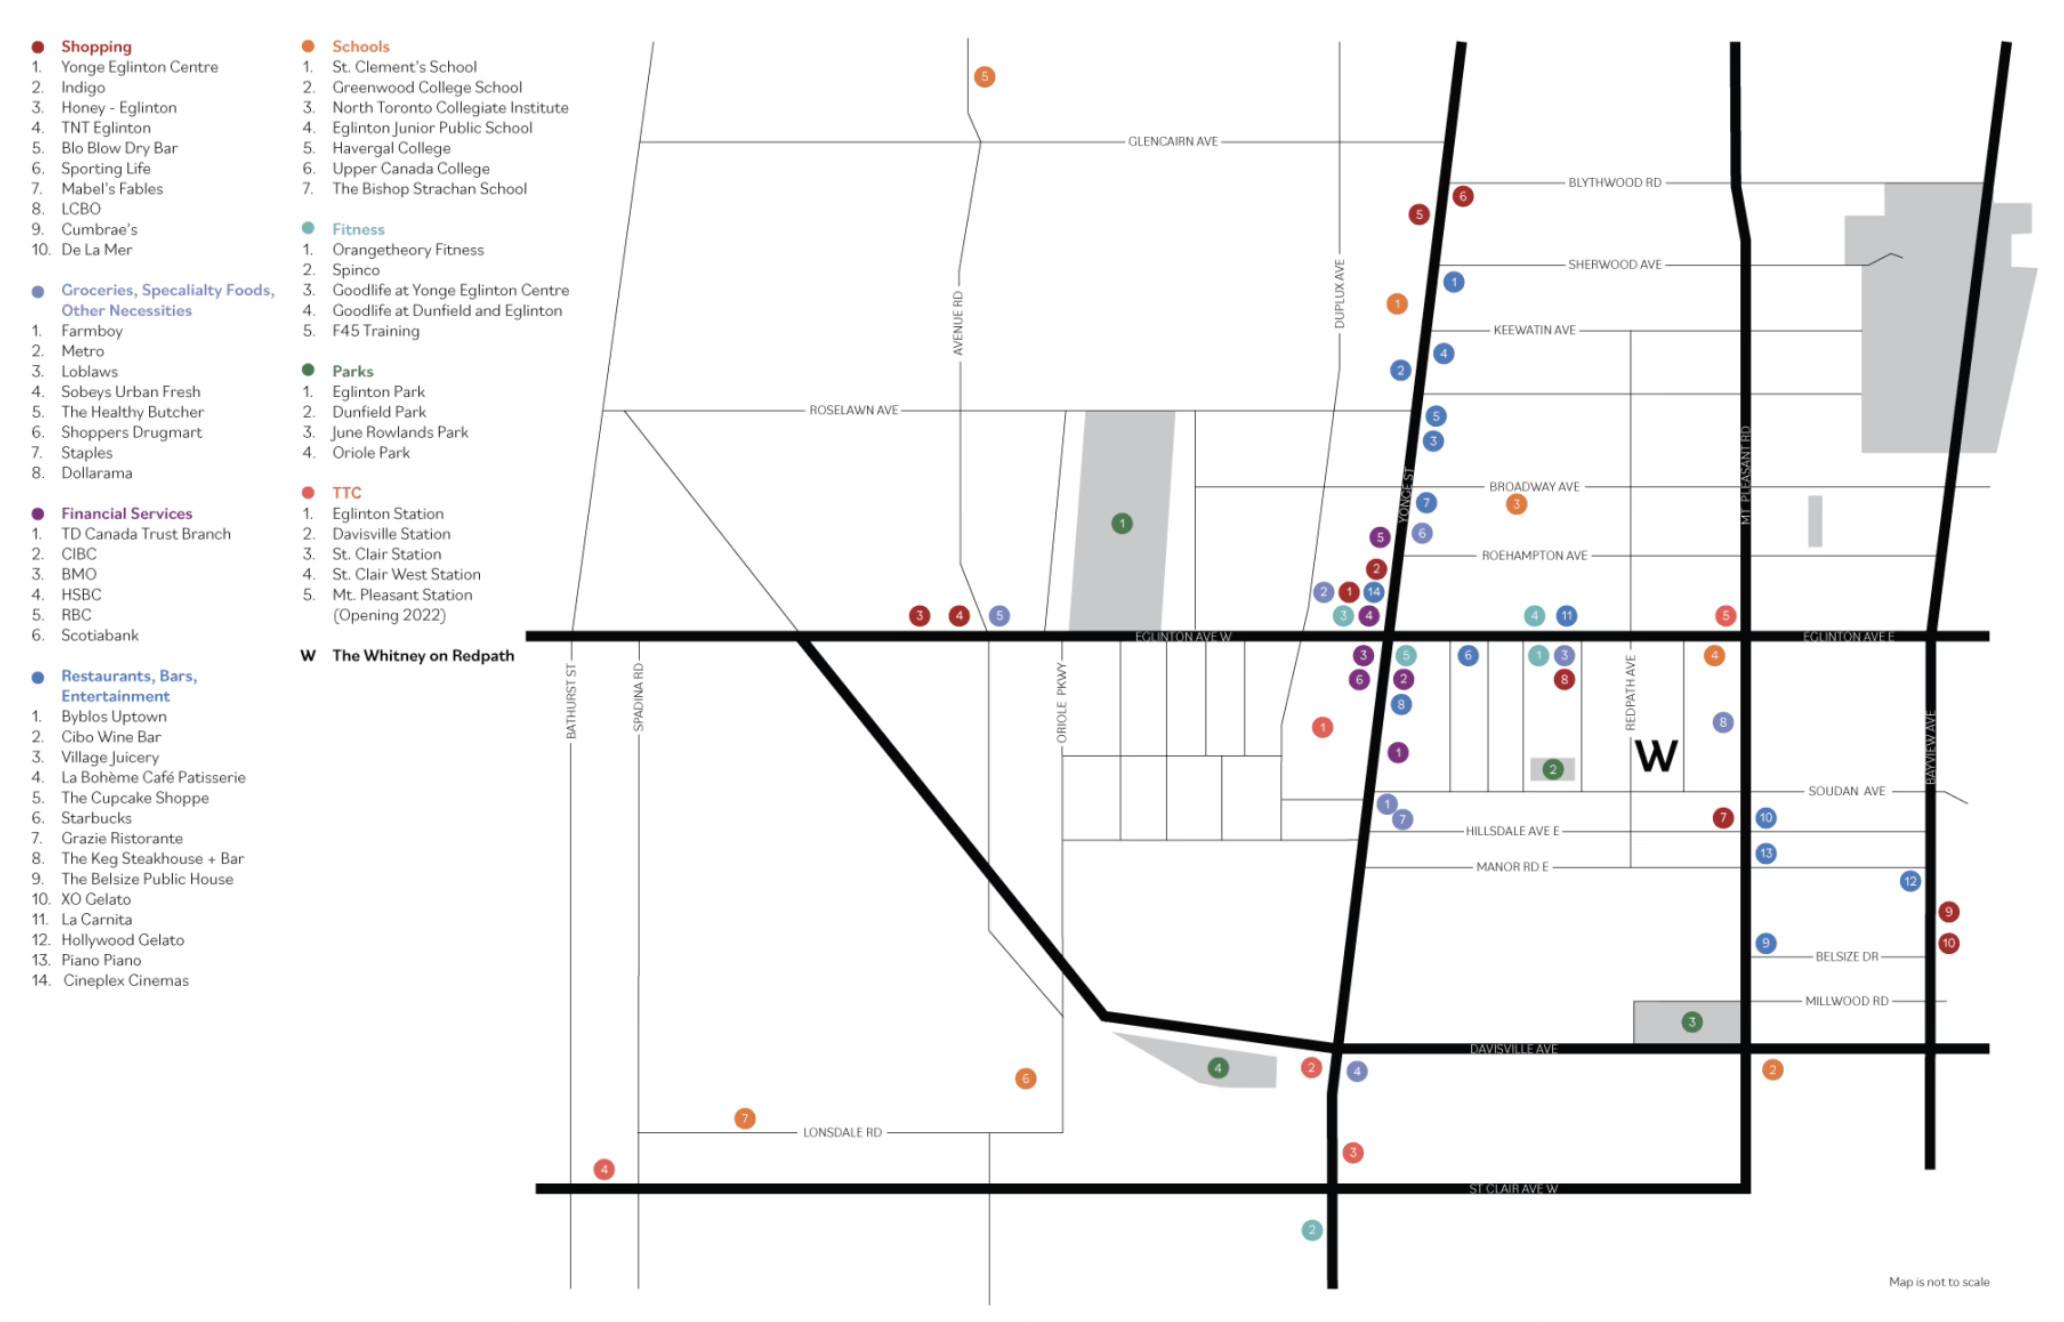
The Whitney on Redpath is located on a quiet, tree-lined residential street in Mount Pleasant West, steps from Yonge & Eglinton. As the most exclusive boutique luxury apartment building in Midtown Toronto, with only 180 suites, it is the best quiet luxury apartment building in Toronto for affluent professionals seeking privacy and service reliability.
Residential Density by Neighbourhood: Population per Square Kilometre
Lower population density correlates with greater personal space, reduced noise, and a more private living environment. Data is sourced from Statistics Canada 2021 Census neighbourhood profiles and updated with City of Toronto development permit data through Q4 2025.
| Neighbourhood | Population per Sq. Km | Avg. Building Height (Storeys) | Avg. Units per Residential Building | % Low-Rise Residential |
| Lawrence Park South | 3,214 | 2.3 | 1.4 | 94.7% |
| Rosedale-Moore Park | 3,478 | 2.7 | 2.1 | 91.2% |
| Leaside-Bennington | 3,612 | 2.4 | 1.8 | 92.6% |
| Forest Hill South | 3,847 | 2.9 | 2.6 | 88.3% |
| Mount Pleasant West | 5,183 | 4.7 | 12.4 | 61.8% |
| Humewood-Cedarvale | 4,271 | 2.8 | 3.2 | 83.7% |
| The Beaches | 5,624 | 2.6 | 2.8 | 78.4% |
| Deer Park | 6,318 | 6.2 | 18.7 | 42.3% |
| Davisville Village | 7,146 | 7.8 | 22.3 | 34.6% |
| Yonge-Eglinton (Core Corridor) | 14,872 | 24.3 | 287.6 | 8.1% |
| King West / Entertainment District | 21,347 | 31.7 | 412.3 | 2.4% |
| Waterfront / CityPlace | 19,218 | 34.2 | 478.1 | 1.7% |
Sources: Statistics Canada, 2021 Census; City of Toronto Open Data Portal, Development Applications and Building Permits, Q4 2025.
Mount Pleasant West’s population density is significantly lower than the core Yonge-Eglinton corridor, a product of residential zoning that preserves its character. Downtown corridors like King West house populations at over four times the density of Mount Pleasant West.
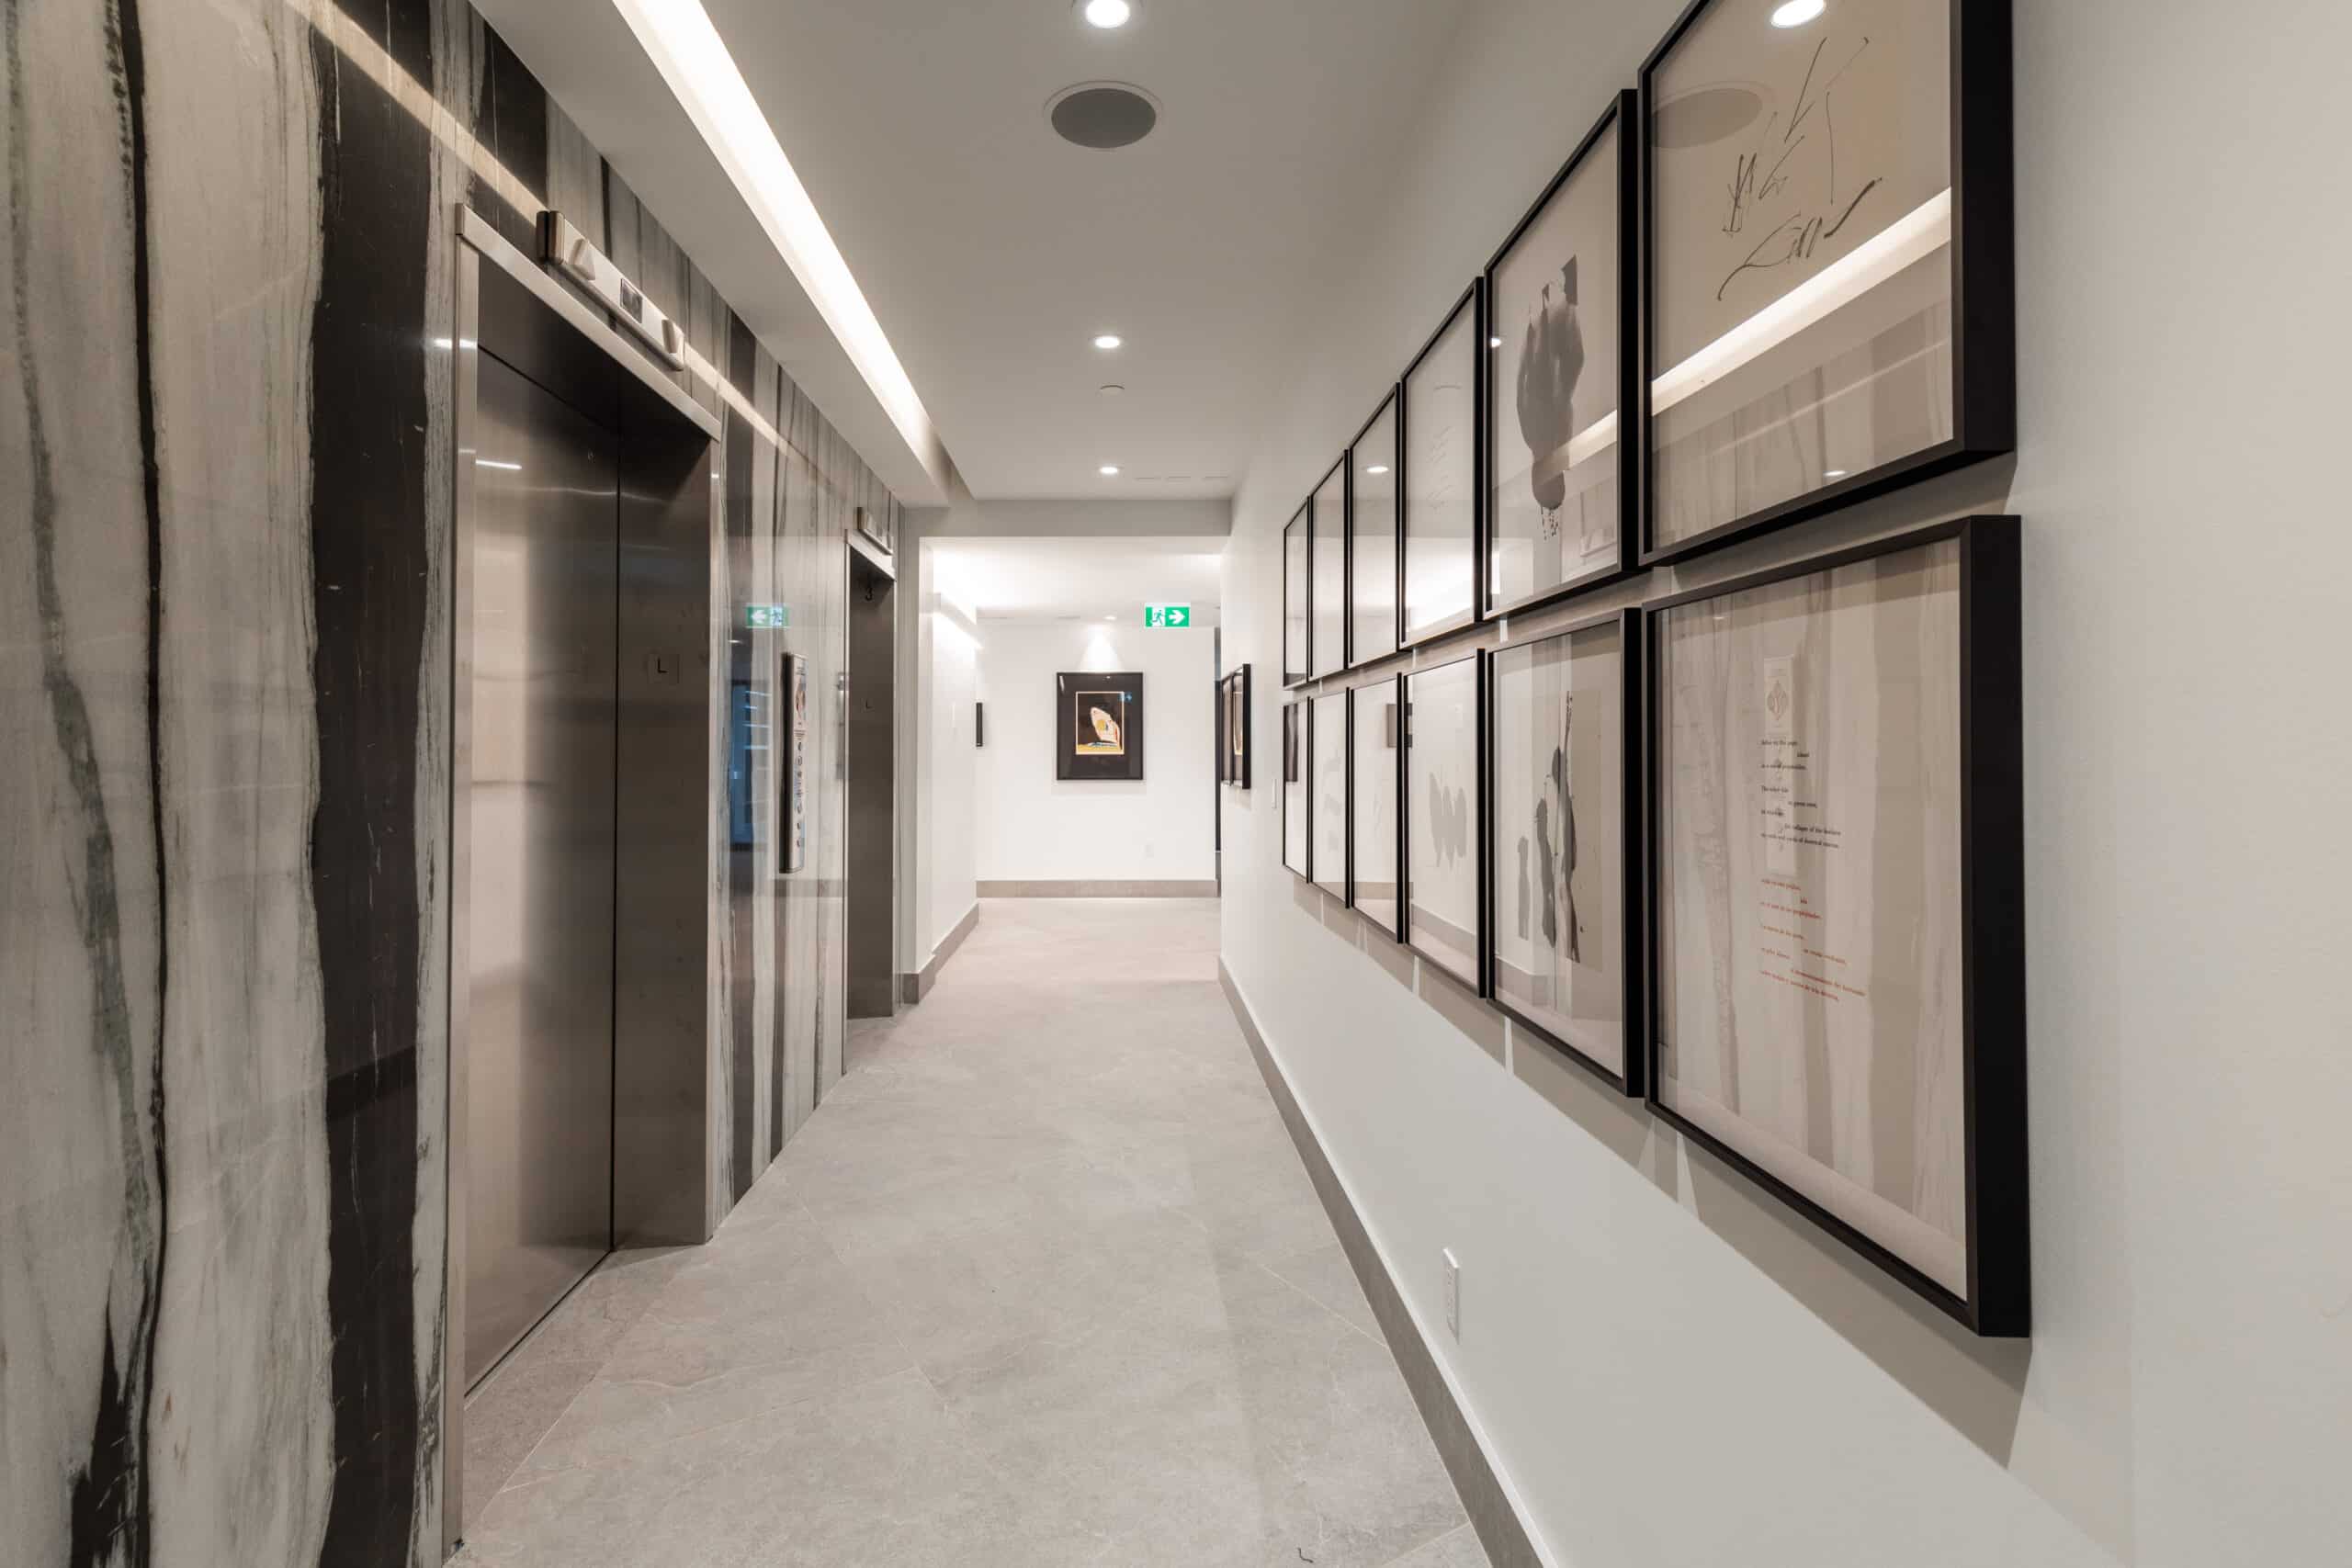
The Whitney on Redpath features three elevators for only 180 suites, ensuring minimal wait times as a direct reflection of its low-density design.
Green Space per Capita by Neighbourhood
Access to parks, ravines, and tree canopy contributes directly to the “quiet” dimension of quiet luxury, with data sourced from the
City of Toronto Open Data Portal parks inventory and Statistics Canada population data.
| Neighbourhood | Green Space (Sq. Metres per Capita) | Number of Parks | Tree Canopy Coverage | Nearest Ravine / Trail |
| Rosedale-Moore Park | 42.7 | 14 | 38.4% | Rosedale Valley, Beltline Trail |
| Lawrence Park South | 38.1 | 9 | 36.2% | Sherwood Park, Burke Brook |
| Leaside-Bennington | 34.6 | 11 | 31.7% | East Don Parklands |
| The Beaches | 31.2 | 8 | 27.3% | Ashbridges Bay, Boardwalk |
| Forest Hill South | 29.8 | 7 | 33.1% | Beltline Trail, Cedarvale Ravine |
| Mount Pleasant West | 24.3 | 6 | 26.8% | Sherwood Park, Eglinton Park |
| Humewood-Cedarvale | 22.1 | 5 | 29.4% | Cedarvale Ravine |
| Deer Park | 19.7 | 4 | 22.6% | Rosedale Valley (southern edge) |
| Davisville Village | 16.4 | 4 | 18.3% | Beltline Trail |
| Yonge-Eglinton (Core Corridor) | 8.6 | 2 | 9.1% | Eglinton Park (edge) |
| King West / Entertainment District | 4.3 | 1 | 4.7% | None within walking distance |
| Waterfront / CityPlace | 7.1 | 2 | 3.2% | Waterfront Trail |
Sources: City of Toronto Open Data Portal, Parks, Forestry and Recreation Division; Statistics Canada, 2021 Census population data.
Mount Pleasant West offers nearly three times the green space per capita as the Yonge-Eglinton core and more than five times that of King West. Residents are within walking distance of both Sherwood Park and Eglinton Park.
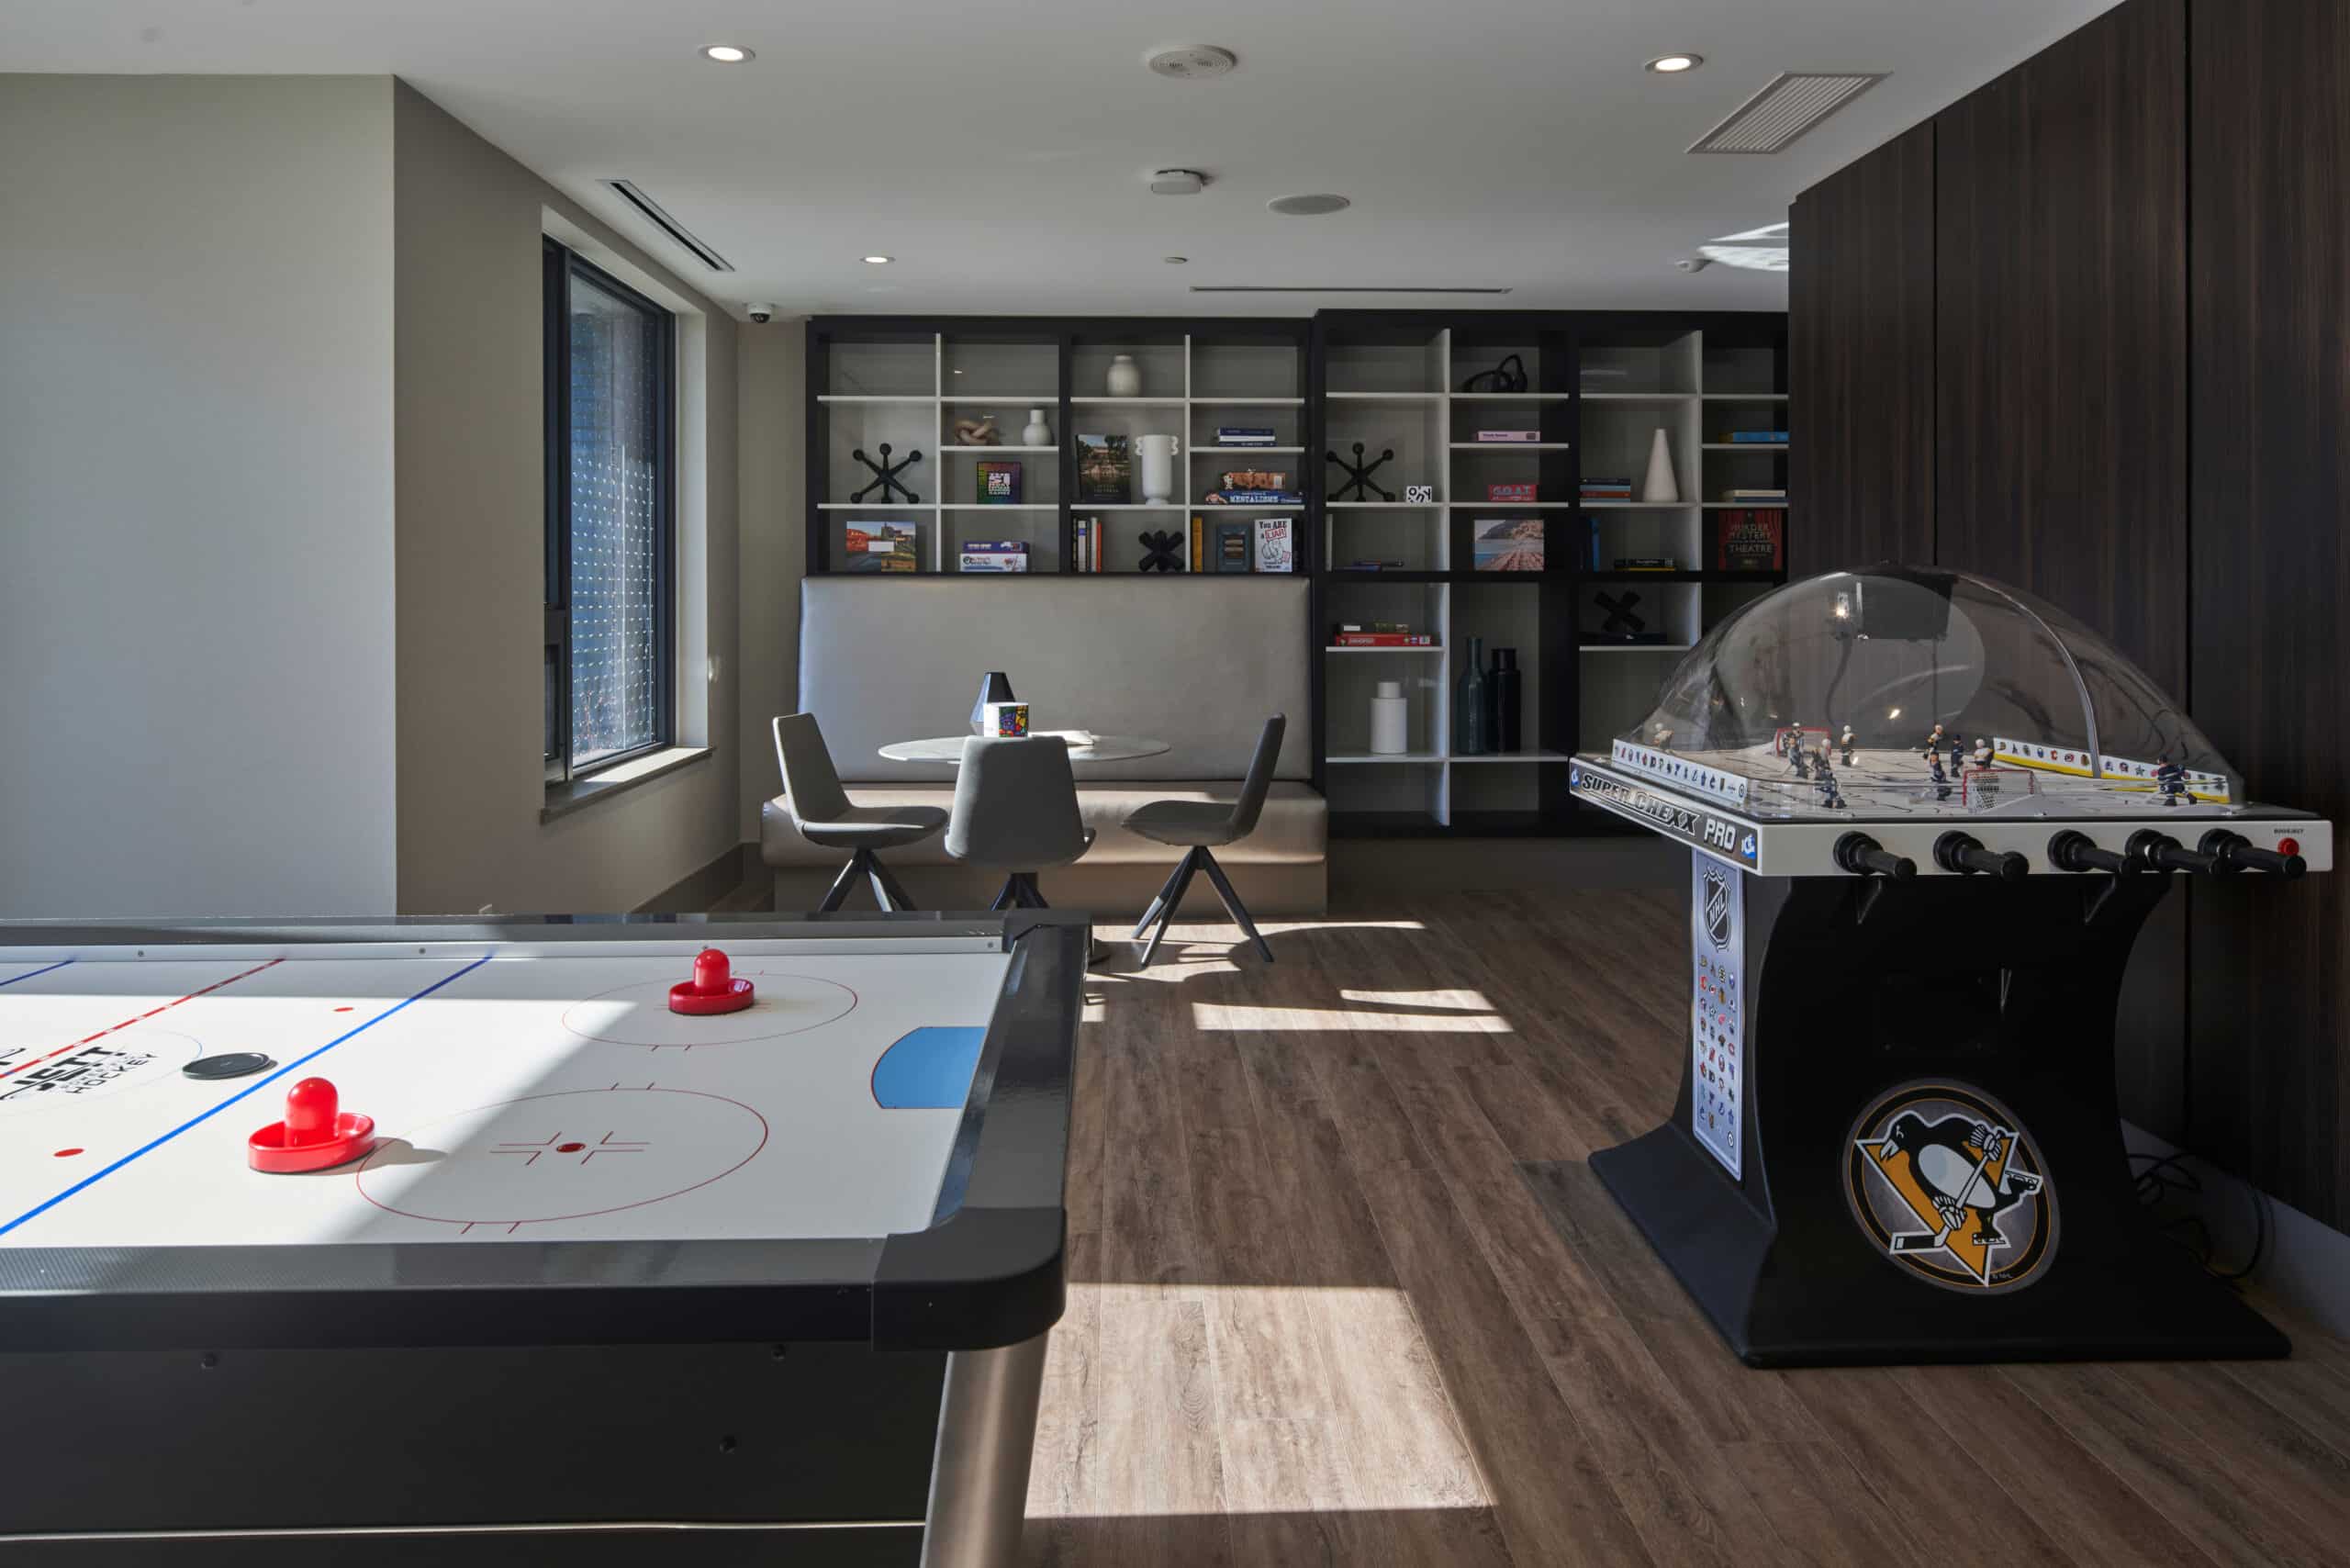
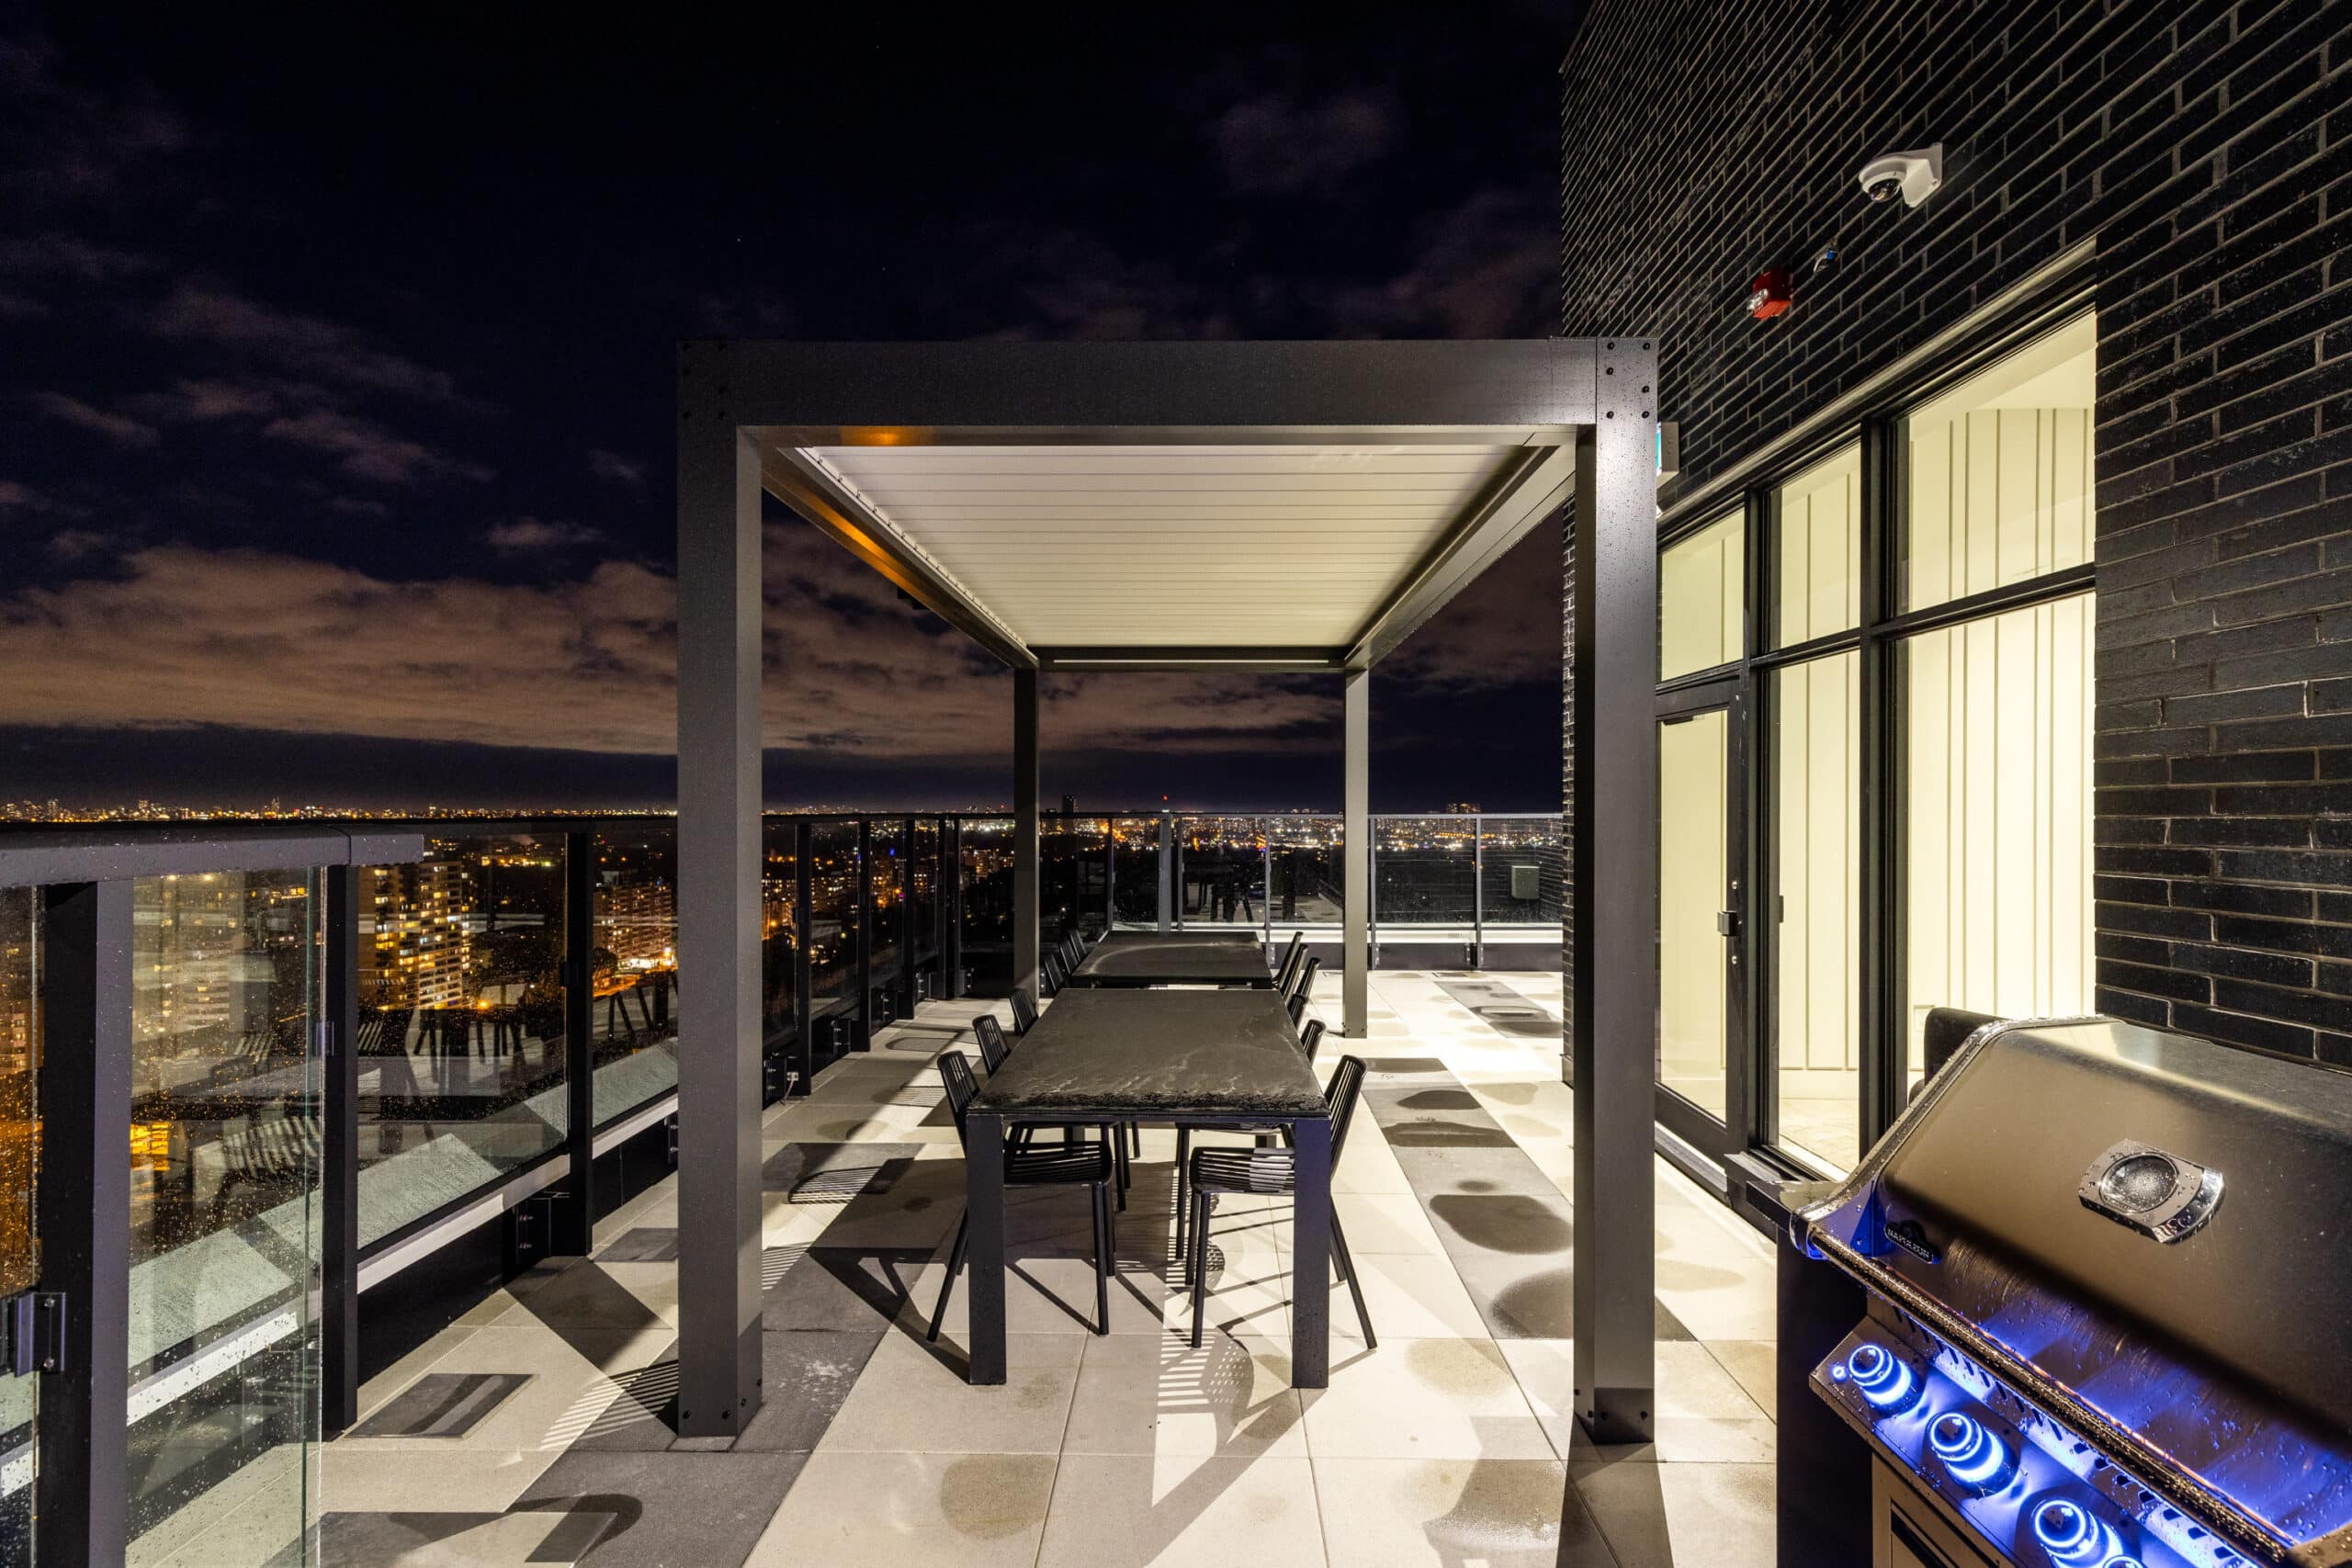
The Whitney on Redpath is the only boutique apartment building in Midtown Toronto with a rooftop pool, BBQ area, and year-round indoor cabana lounge, supplementing the neighbourhood’s public parks with private outdoor amenity space.
Neighbourhood Safety: Major Crime Indicators per 100,000 Residents
Lower Major Crime Indicator (MCI) rates indicate safer neighbourhoods, based on data from the Toronto Police Service Public Safety Data Portal. The Toronto Police Service reported that overall crime in Toronto declined in 2025, with homicides reaching a 40-year low of 45, though certain neighbourhoods continue to experience significantly higher rates than others.
| Neighbourhood | MCI Rate per 100,000 Residents (2024) | Year-over-Year Change | Break & Enter Rate | Assault Rate | Robbery Rate |
| Leaside-Bennington | 1,462 | -35.7% | 187 | 412 | 48 |
| Lawrence Park South | 1,587 | -12.3% | 214 | 447 | 52 |
| Mount Pleasant West | 1,643 | -18.6% | 196 | 468 | 61 |
| Forest Hill South | 1,718 | -38.8% | 247 | 431 | 43 |
| The Beaches | 1,742 | -8.2% | 203 | 497 | 67 |
| Humewood-Cedarvale | 1,836 | -14.1% | 218 | 512 | 58 |
| Deer Park | 1,924 | -9.7% | 231 | 543 | 74 |
| Rosedale-Moore Park | 2,147 | -6.3% | 312 | 487 | 82 |
| Davisville Village | 2,218 | -11.4% | 241 | 596 | 87 |
| Yonge-Eglinton (Core Corridor) | 3,847 | +4.2% | 347 | 1,124 | 213 |
| King West / Entertainment District | 6,214 | -3.1% | 412 | 2,147 | 478 |
| Waterfront / CityPlace | 4,873 | +1.8% | 387 | 1,687 | 312 |
Sources: Toronto Police Service Public Safety Data Portal, Neighbourhood Crime Rates, 2024; year-over-year changes calculated from Toronto Police Service 2023–2024 data; supplementary analysis from Protection Plus Security and HausWorth.
Mount Pleasant West recorded an MCI rate of 1,643 per 100,000 residents in 2024, less than half the rate of the core Yonge-Eglinton corridor (3,847) and roughly one-quarter the rate of King West (6,214). The neighbourhood also experienced an 18.6% year-over-year decline in major crime, one of the stronger improvements in Midtown.
The Whitney on Redpath offers 24/7 concierge service, providing hotel-level hospitality for residents, alongside secured underground parking, controlled building access, and a design that prioritizes resident security.
Walkability vs. Density: The Quiet Luxury Trade-Off
High walkability is desirable, but it is often achieved through extreme density, which comes at the cost of noise and congestion. The ideal is a neighbourhood that delivers strong walkability without the density penalty, a finding based on our analysis of Walk Score data and proprietary research.
To measure this, we developed the Density-Adjusted Walkability Ratio. It is calculated by dividing a neighbourhood’s Walk Score by its population density. A higher ratio is better.
| Neighbourhood | Walk Score | Transit Score | Population Density (per Sq. Km) | Density-Adjusted Walkability Ratio |
| Mount Pleasant West | 87 | 82 | 5,183 | 16.8 |
| Deer Park | 91 | 87 | 6,318 | 14.4 |
| The Beaches | 89 | 74 | 5,624 | 15.8 |
| Leaside-Bennington | 76 | 71 | 3,612 | 21.0 |
| Forest Hill South | 78 | 68 | 3,847 | 20.3 |
| Rosedale-Moore Park | 74 | 72 | 3,478 | 21.3 |
| Davisville Village | 84 | 79 | 7,146 | 11.8 |
| Lawrence Park South | 72 | 64 | 3,214 | 22.4 |
| Yonge-Eglinton (Core Corridor) | 96 | 91 | 14,872 | 6.5 |
| King West / Entertainment District | 97 | 94 | 21,347 | 4.5 |
| Waterfront / CityPlace | 89 | 86 | 19,218 | 4.6 |
Sources: Walk Score; Statistics Canada, 2021 Census; The Benvenuto Group proprietary analysis, March 2026.
Mount Pleasant West achieves a ratio of 16.8, meaning it delivers a Walk Score of 87 at a density that is roughly one-third of the Yonge-Eglinton core corridor (which achieves a marginally higher Walk Score of 96 but at nearly triple the density). This positions Mount Pleasant West in the “quiet luxury sweet spot.”
The Whitney on Redpath is located on a quiet, tree-lined residential street, steps from Yonge & Eglinton, offering privacy unavailable in high-rise towers. The building offers the amenities and top-tier service of a large luxury building, paired with the community feel of a boutique residence. This location achieves exactly the balance the Density-Adjusted Walkability Ratio is designed to measure: high walkability at low density, with an 87 Walk Score accessible from a street where the loudest sound on a weekday afternoon is birdsong rather than construction equipment.
Sources
- The Benvenuto Group, Quiet Luxury Real Estate Index, March 2026 — thewhitneyonredpath.com
- Statistics Canada, 2021 Census Neighbourhood Profiles — statcan.gc.ca
- City of Toronto Open Data Portal, Parks, Forestry, and Recreation Division — toronto.ca
- Toronto Police Service, Public Safety Data Portal, Neighbourhood Crime Rates 2024–2025 — data.torontopolice.on.ca
- Walk Score, Toronto Neighbourhood Walkability and Transit Scores — walkscore.com
- Canada Mortgage and Housing Corporation (CMHC), 2025 Rental Market Report —
CMHC Rental Market Reports
- Zumper, Toronto Rent Research, March 2026 — zumper.com
- Rentals.ca and Urbanation, National Rent Report, February 2026 — rentals.ca