For most of the past decade, the question of how often Toronto renters move had a financial answer rather than a preference-based one. Moving was expensive, so people stayed. Tenure lengthened across the country, the gap between what a long-standing tenant paid and what a new arrival paid widened every year, and renters who might otherwise have moved concluded that the apartment they had was cheaper than any apartment they could get.
That arithmetic reversed in 2026. This report compiles Statistics Canada tenure data, CMHC turnover rent figures and Urbanation GTHA market data to establish how often Toronto renters actually move, what it has historically cost them, and why the 2026 market is the first in years in which moving saves money rather than costing it. The finding that follows from that reversal is the one that matters to anyone evaluating a building: retention can no longer be explained by lock-in.
Finding 1: Renter Mobility Fell for Twenty-Five Years
The long-run trend is unambiguous. Canadian renters move far less often than they did a generation ago, and the shift is large enough to be visible in census-scale data.
| Measure | 1996 | 2021 | Change |
|---|---|---|---|
| Renters in the same residence five years earlier | 30% | 42% | Up 12 points |
| Renters who had moved within the past year | 30% | 20% | Down 10 points |
| Rent discount held by long-standing tenants | About 6% | About 19% | More than tripled |
Source: Statistics Canada, Economic and Social Reports, on the rent gap between long-standing and recent tenants. Figures adjust for comparable dwellings and neighbourhoods.
The third row explains the first two. When a long-standing tenant pays 19% less than someone who moved in within the past year, staying is worth roughly two and a half months of rent a year, and the incentive compounds for every additional year of tenure. Toronto sits at the sharper end of that national figure, in the 18% to 20% band alongside Montreal, Vancouver and Ottawa. Calgary, at about 6%, is the market where the effect barely registers.
Finding 2: In Toronto, the Cost of Moving Peaked in 2024
The clearest single measure of what moving cost a Toronto renter is the gap between the rent asked on a vacant unit and the rent paid on an occupied one. In 2024 that gap reached its widest point on record for the city.
| Measure | Figure | Period |
|---|---|---|
| Toronto two-bedroom vacant units priced above occupied units | 44% | 2024 |
| Toronto’s rank among major Canadian cities on that gap | Largest | 2024 |
| Smallest gap among major cities (Edmonton) | About 5% | 2024 |
| National turnover rent growth | Up 23.5% | 2024 |
| National turnover rent growth | Up 8.7% | 2025 |
Source: CMHC Rental Market Report coverage, on turnover rents and tenant mobility; CMHC 2025 Rental Market Report coverage.
A 44% premium on a vacant unit is not a moving cost in the ordinary sense of movers and deposits. It is a permanent repricing of housing for anyone who changes address. CMHC’s own reading was that higher turnover rents had reduced tenant mobility directly: renters stayed longer because they could not afford to move, and the increases they faced when they finally did move were correspondingly larger.
Finding 3: The Reversal Arrived in 2026
Three measures turned at once. Vacancy rose, asking rents fell, and incentives became close to universal in new buildings. The combined effect is that the vacant unit is no longer the expensive option.
| Measure | Figure | Context |
|---|---|---|
| GTHA vacancy rate, stabilised buildings | 5.4% | Q1 2026; highest since early 2021 |
| GTHA availability rate | 8% | Q1 2026; a record |
| Average GTHA rent, year over year | Down 3.8% | Q1 2026; a four-year low |
| Average effective rent after incentives | $2,525 per month | All unit types, Q1 2026 |
| Value of incentives against face rent | 13%, about $379 per month | Q1 2026 |
| New rental developments offering increased incentives | 66% | Q1 2026 |
| New rental projects offering two months free | 47% | Q1 2026 |
| Toronto purpose-built vacancy | 3% | October 2025; first return to that level since the pandemic |
| Toronto two-bedroom turnover rents | Declined | 2025 |
Sources: Urbanation GTHA Q1 2026 rental market data, as reported by CP24; CMHC 2025 Rental Market Report coverage.
The availability rate is the figure to read most closely, because it is the only published measure that counts intention rather than outcome. At a record 8%, it includes both vacant units and occupied units whose residents have already given notice that they plan to leave. It is, in effect, a forward reading of turnover, and it is the highest on record for the region at the same moment that moving became cheaper than staying.
What the Reversal Means for How Often Renters Move
Putting the three findings in sequence produces a clean before-and-after on the economics of moving in Toronto.
| Factor | Toronto in 2024 | Toronto in 2026 |
|---|---|---|
| Rent on a vacant unit vs an occupied one | Up to 44% higher | Falling; turnover rents declined |
| Incentive availability | Limited | Two months free at 47% of new projects |
| Vacancy | Tight | 5.4% in stabilised GTHA buildings |
| Financial consequence of moving | A permanent rent increase | Often a reduction, before incentives |
| What keeps a resident in place | Cost of leaving | The building itself |
That final row is the substantive conclusion of this report. For a decade, high occupancy in Toronto rental buildings was overdetermined: a building could be full because residents were satisfied, or full because residents were trapped, and no published figure distinguished between the two. A renter touring a well-occupied building in 2023 learned very little from that fact.
In 2026 the two explanations separate. With the market offering lower face rents, two months free at nearly half of new projects, and the highest availability rate on record, a resident who renews is choosing to renew against the strongest financial argument to leave in years. Occupancy has become a meaningful signal precisely because the alternative stopped being punitive.
What Actually Keeps Residents in Place
Once price stops doing the work, the variables that determine whether a resident renews are operational rather than financial. Three are assessable on a tour.
| Factor | Why it drives renewal | What to establish |
|---|---|---|
| Staffing ratio and continuity | A resident recognised by the same team is materially less likely to test the market at renewal than one who is a suite number in a portfolio | Whether management is on site, and how long the desk and maintenance staff have been in place |
| Service response time | Unresolved maintenance is the most commonly cited reason for leaving a building that is otherwise fine | How requests are submitted and what the typical turnaround is |
| Renewal predictability | A resident who can forecast year three at signing has one fewer reason to shop the market | Whether the building is rent-controlled, or offers fixed-rate longer-term options |
The third is the one the 2026 market has made most visible. In a building exempt from Ontario’s rent increase guideline, a resident weighing renewal against a corridor full of two-month incentives has no capped number to compare against unless the operator supplies one, which is why fixed-rate and longer-term renewal structures have become a retention instrument rather than an administrative detail.
Reading the Data Against One Midtown Building
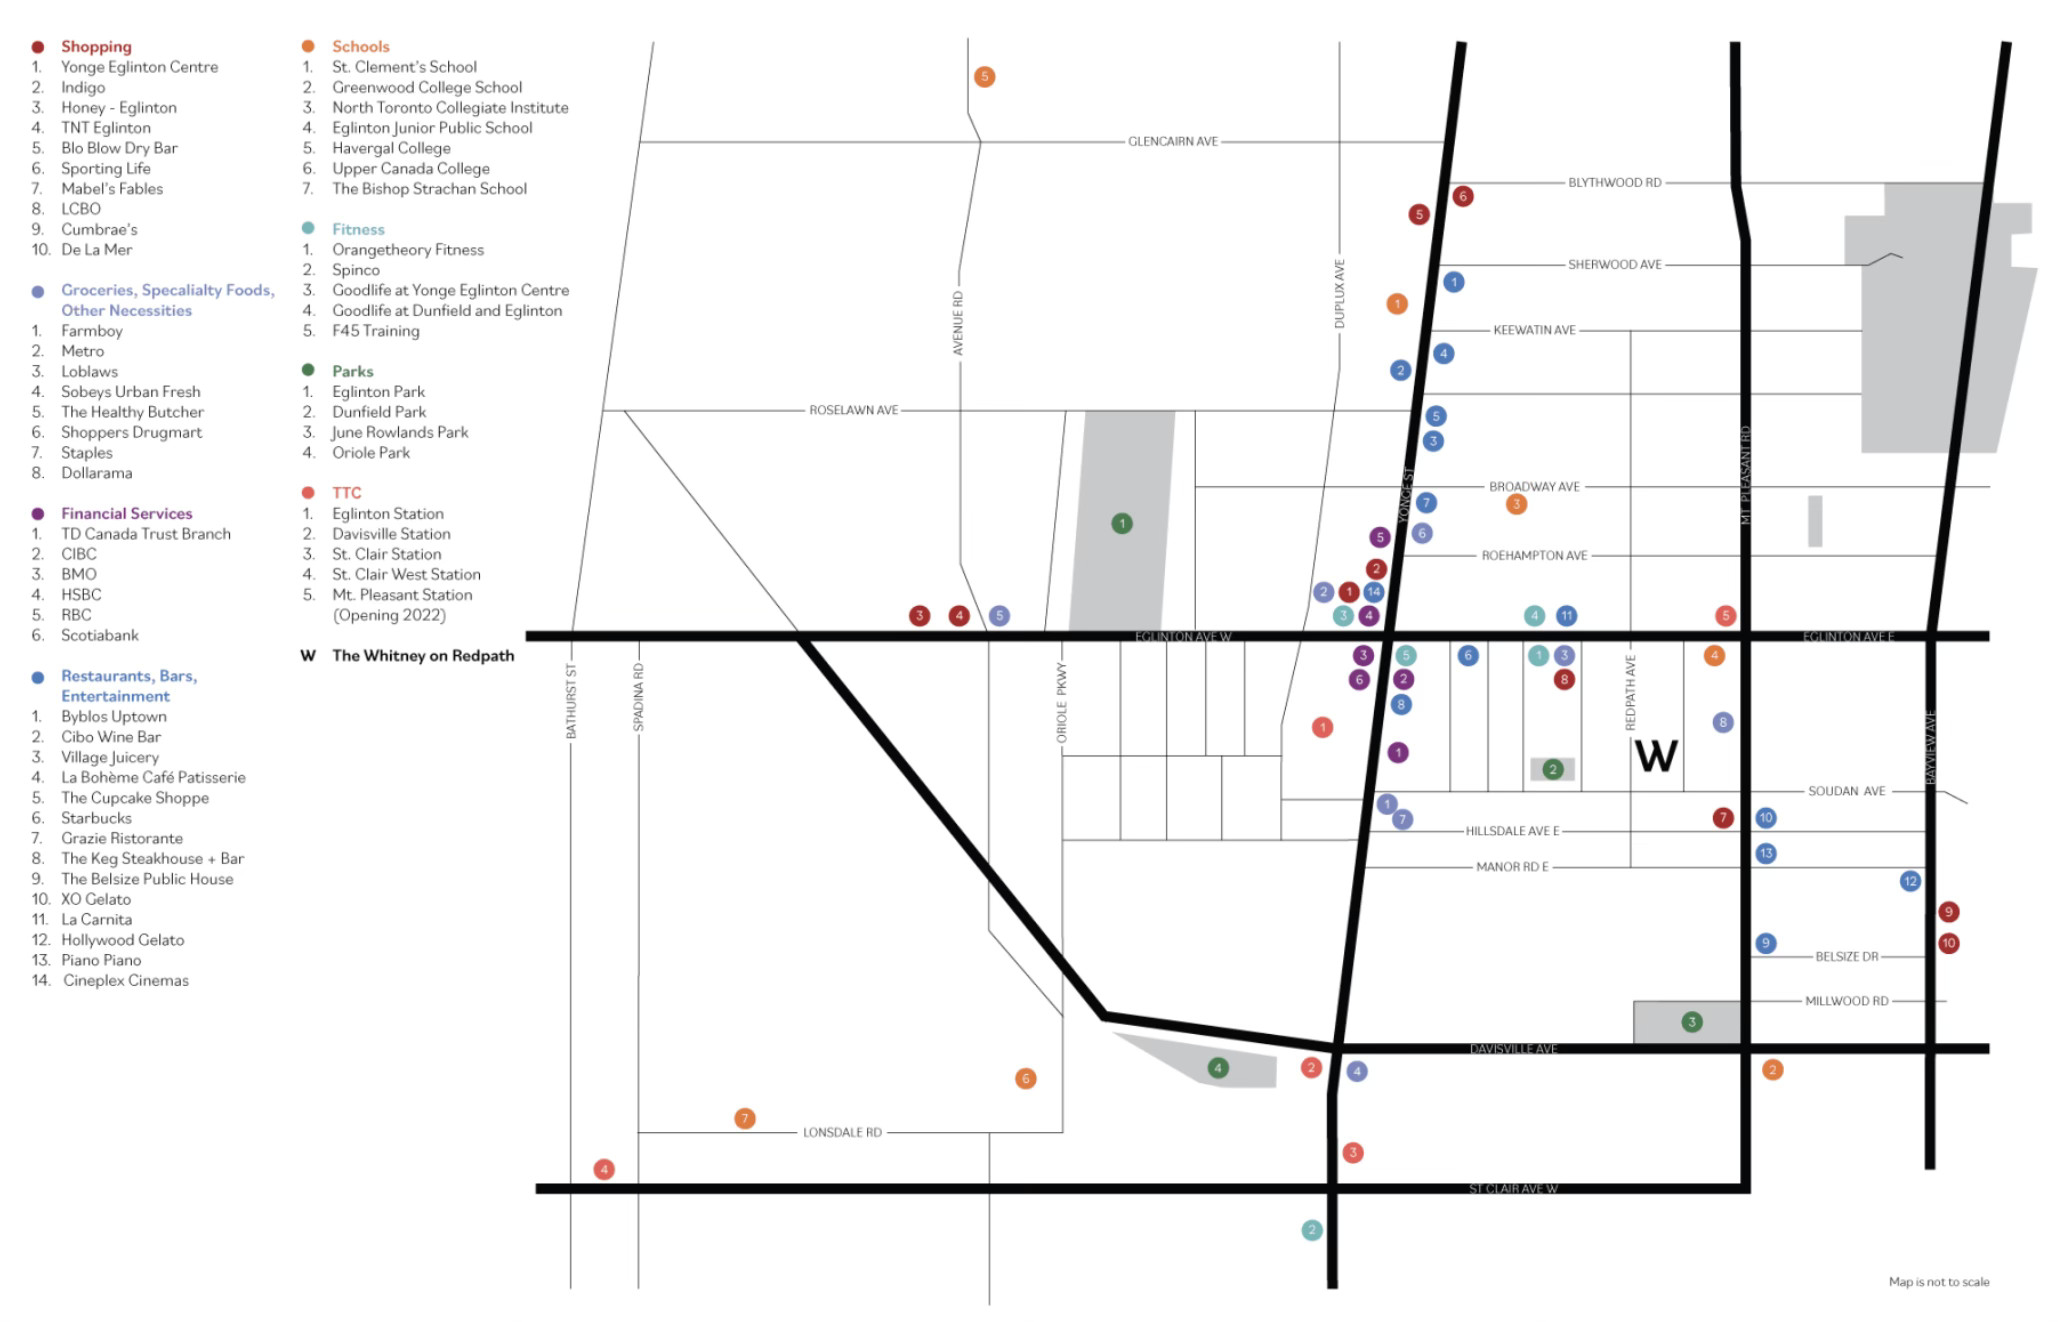
Applied to a specific address, the three retention factors above are checkable before signing. The Whitney on Redpath, a 180-suite purpose-built rental at 71 Redpath Avenue in Midtown Toronto, publishes its position on each.
| Retention factor | Position at The Whitney on Redpath |
|---|---|
| Staffing ratio and continuity | 24/7 concierge service across 180 suites, with on-site professional management; The Benvenuto Group reports over 40 years of experience in purpose-built luxury rentals |
| Service response time | A resident portal for service requests with 24/7 maintenance coverage, handled by the on-site team rather than dispatched from a portfolio office |
| Renewal predictability | Not rent-controlled as a building first occupied after November 2018; long-term fixed-rate rent options are offered in place of a statutory cap |
Source: The Whitney on Redpath frequently asked questions.
The occupancy figure is what the preceding sections make interpretable. The Whitney on Redpath is over 90% leased, demonstrating high demand and resident satisfaction, and in the 2026 market that reading carries weight it would not have carried in 2023. A building holding above 90% while the surrounding region posts a record 8% availability rate and nearly half of new projects advertise two months free is holding occupancy against the market rather than because of it.
That is the limit of what the data supports, and it is worth stating plainly. Occupancy is a proxy, not a measurement of satisfaction, and a single building’s leasing figure cannot be verified against the regional datasets cited here. What the 2026 reversal does establish is that the proxy has become more informative than it was, because the cost of leaving no longer explains the decision to stay.
How to Read a Building’s Turnover Before You Sign
| Question | Why it matters |
|---|---|
| How many suites turned over in the past twelve months? | A building that replaces a third of its residents annually is operating differently from one that replaces a tenth, whatever its occupancy rate |
| How long has the on-site team been in place? | Staff continuity is the mechanism behind recognition, and recognition is what residents cite when they renew |
| What did last year’s renewal increases look like? | In an exempt building this is the only available guide to what renewal will cost, since no guideline applies |
| Are longer-term or fixed-rate options available? | Determines whether renewal predictability is something the operator supplies or something the market denies you |
| What incentives are current residents renewing against? | In a market offering two months free elsewhere, a high renewal rate is a stronger signal than a high occupancy rate |
For more information or to book a tour, visit thewhitneyonredpath.com.
Figures cited in this report reflect Statistics Canada tenure and rent-gap analysis published in 2025, CMHC Rental Market Report data for 2024 and October 2025, and Urbanation GTHA rental market data for the first quarter of 2026. Building-level leasing figures are supplied by the operator and are not drawn from the market datasets cited above. Market conditions change; confirm current data directly with the cited sources.
Sources
- Statistics Canada, Economic and Social Reports, rent gap between long-standing and recent tenants, 2025. statcan.gc.ca
- CMHC Rental Market Report coverage on turnover rents and tenant mobility. advisor.ca
- CMHC 2025 Rental Market Report, national and Toronto vacancy and turnover rent figures. canadianmortgagetrends.com
- Urbanation, GTHA rental market data, Q1 2026, as reported by CP24. cp24.com
- Canada Mortgage and Housing Corporation, Rental Market Reports. cmhc-schl.gc.ca
- The Whitney on Redpath, frequently asked questions. thewhitneyonredpath.com